> ## Documentation Index
> Fetch the complete documentation index at: https://tyk.io/docs/llms.txt
> Use this file to discover all available pages before exploring further.
# Tyk Pump
> Install and configure Tyk Pump, the component that moves analytics data out of Redis to persistent storage and external systems.
## What Is Tyk Pump?
Tyk Gateway writes a [traffic log](/docs/api-management/logs/traffic-logs), a structured record of the request and response, for every API call it processes, into Redis. Redis is a temporary, high-throughput buffer, not a long-term store, so something has to move those traffic logs out before they expire.
Tyk Pump is the [open source](https://github.com/TykTechnologies/tyk-pump) component that does this. It reads traffic logs out of Redis and writes them to one or more configured destinations, which Tyk calls pumps. Each pump has a type, such as `mongo` or `sql`, from the [Pump Type Catalog](#pump-type-catalog) below: depending on the type, it can forward traffic logs unaltered, or compute aggregated analytics or metrics from them. A single Tyk Pump process can run several pumps at once, so the same traffic data can be sent to multiple destinations in parallel.
For new integrations, we recommend [OpenTelemetry tracing](/docs/api-management/traces), since it gives you richer per-request detail without the Redis and Tyk Pump hop, and [OpenTelemetry metrics](/docs/api-management/logs-metrics#opentelemetry-metrics) instead.
**A Note on Terminology**
Throughout this documentation, "Tyk Pump" (capitalized) always refers to the component itself. "A pump" or "pump type" refers to one of its configured destinations, such as the `mongo` or `hybrid` pump type.
Tyk Pump serves four distinct outcomes, covered in full elsewhere in the documentation:
* **Populating Tyk Dashboard's built-in Traffic Analytics UI and Log Browser.** These have no other source of data. This is the primary, ongoing purpose of Tyk Pump. See [Dashboard Analytics](/docs/api-management/dashboard-analytics).
* **Forwarding traffic logs, unaltered, to external systems** such as Splunk or Datadog. See [External Data Sinks](/docs/api-management/logs/external-data-sinks).
* **Exposing metrics derived from traffic logs** to Prometheus, StatsD, or DogStatsD. See [Metrics Pumps](/docs/api-management/metrics/metrics-pumps).
* **Storing the results of Tyk Gateway's own uptime tests**, periodic health checks against upstream hosts, for Tyk Dashboard's separate Uptime Tests reporting screen. Unlike the other three, the dedicated uptime pump doesn't work with traffic log data. See [Uptime Tests](/docs/planning-for-production/ensure-high-availability/uptime-tests#monitoring-uptime-tests-in-tyk-dashboard).
This page covers what applies to Tyk Pump regardless of which of those goals you're pursuing: installation, the shape of `pump.conf`, and the full catalog of available pump types.
Tyk Pump is not configurable in Tyk Cloud.
## Architecture
The architecture differs depending on your deployment model:
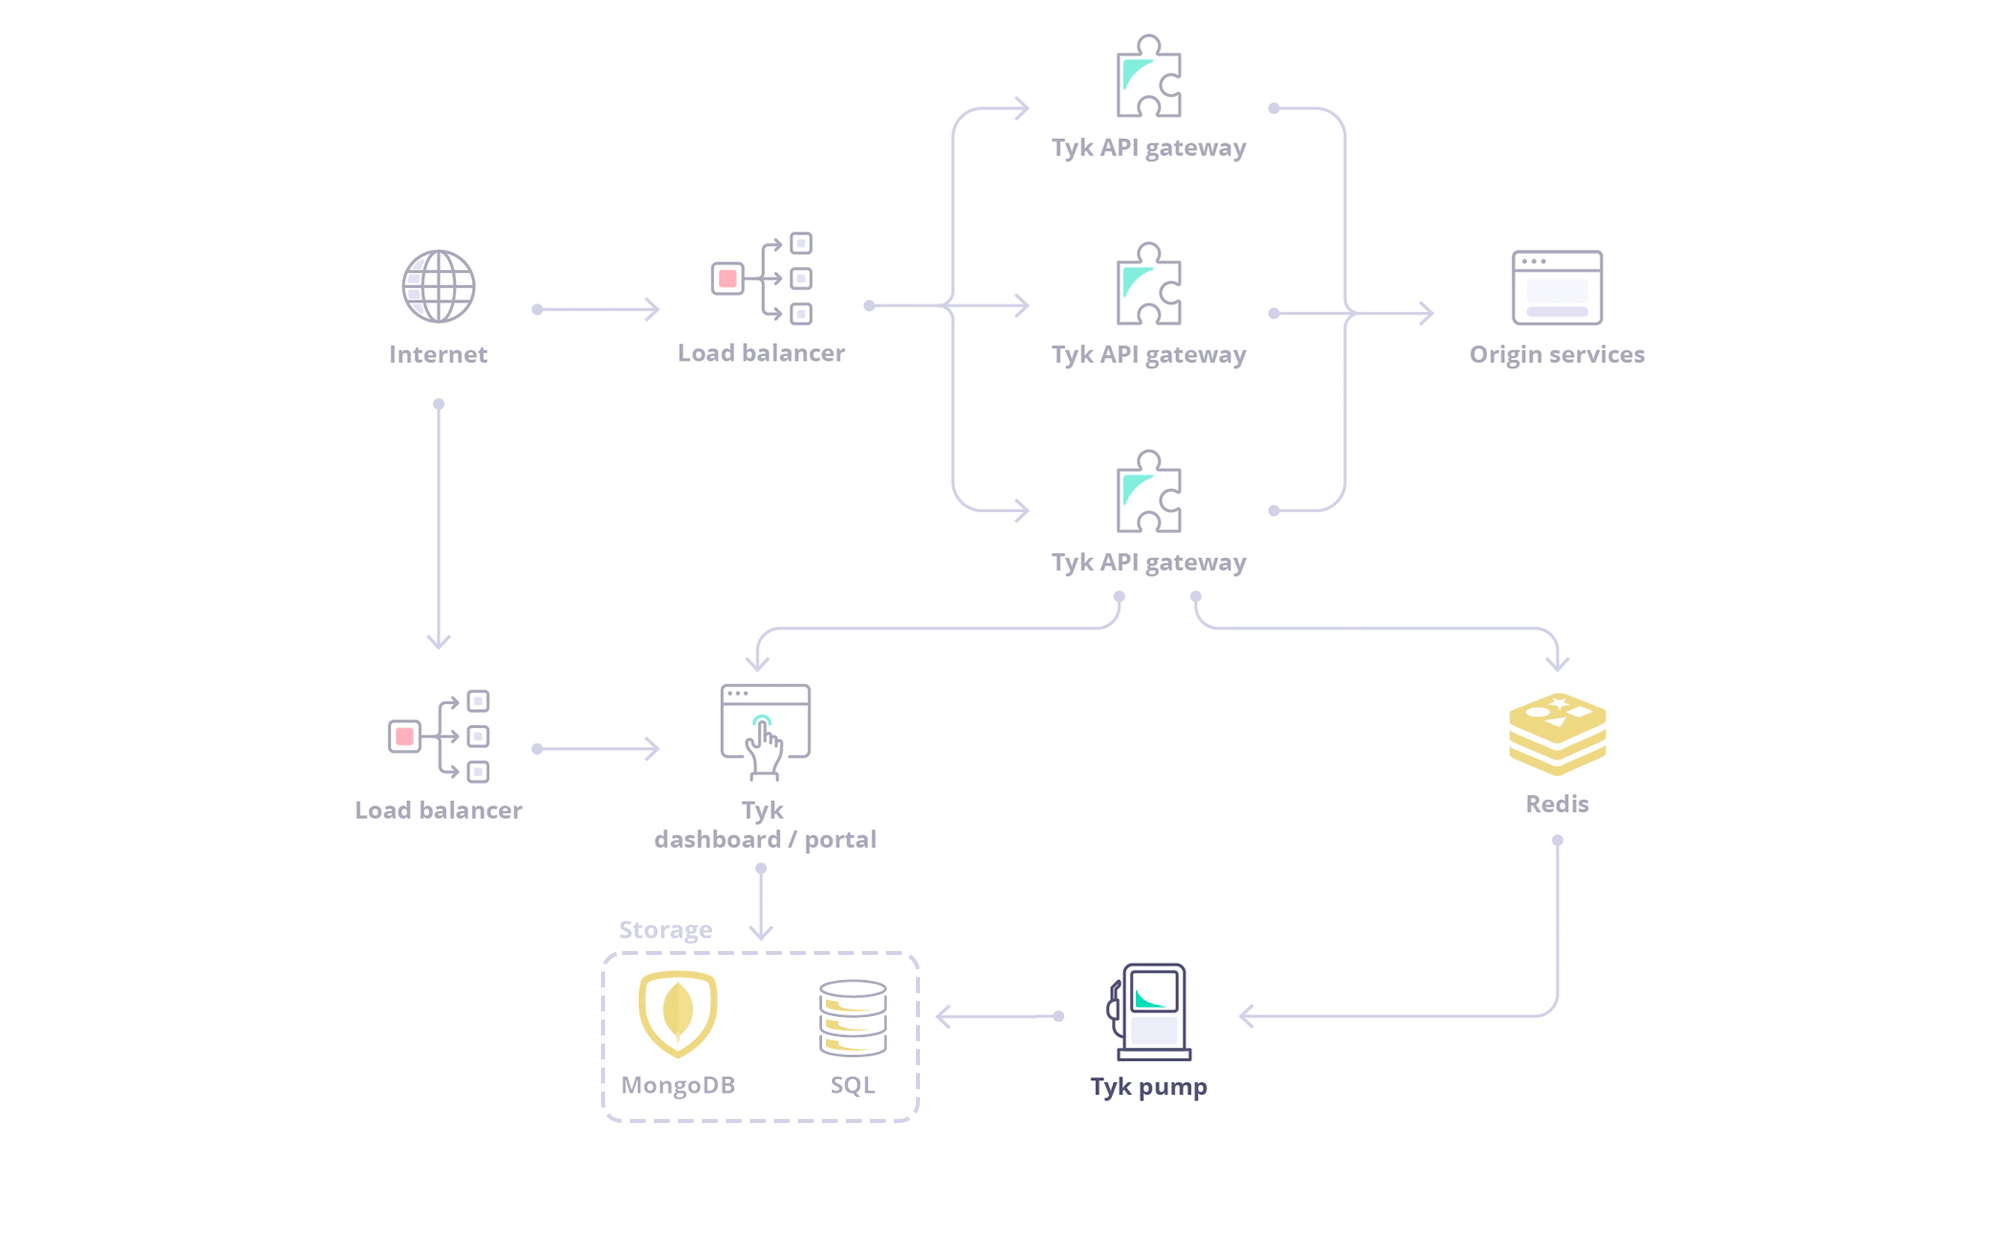
 Tyk Pump is flexible: you can run multiple pumps in a single instance to write the same traffic data to several destinations at once. It's also scalable, both horizontally and vertically.
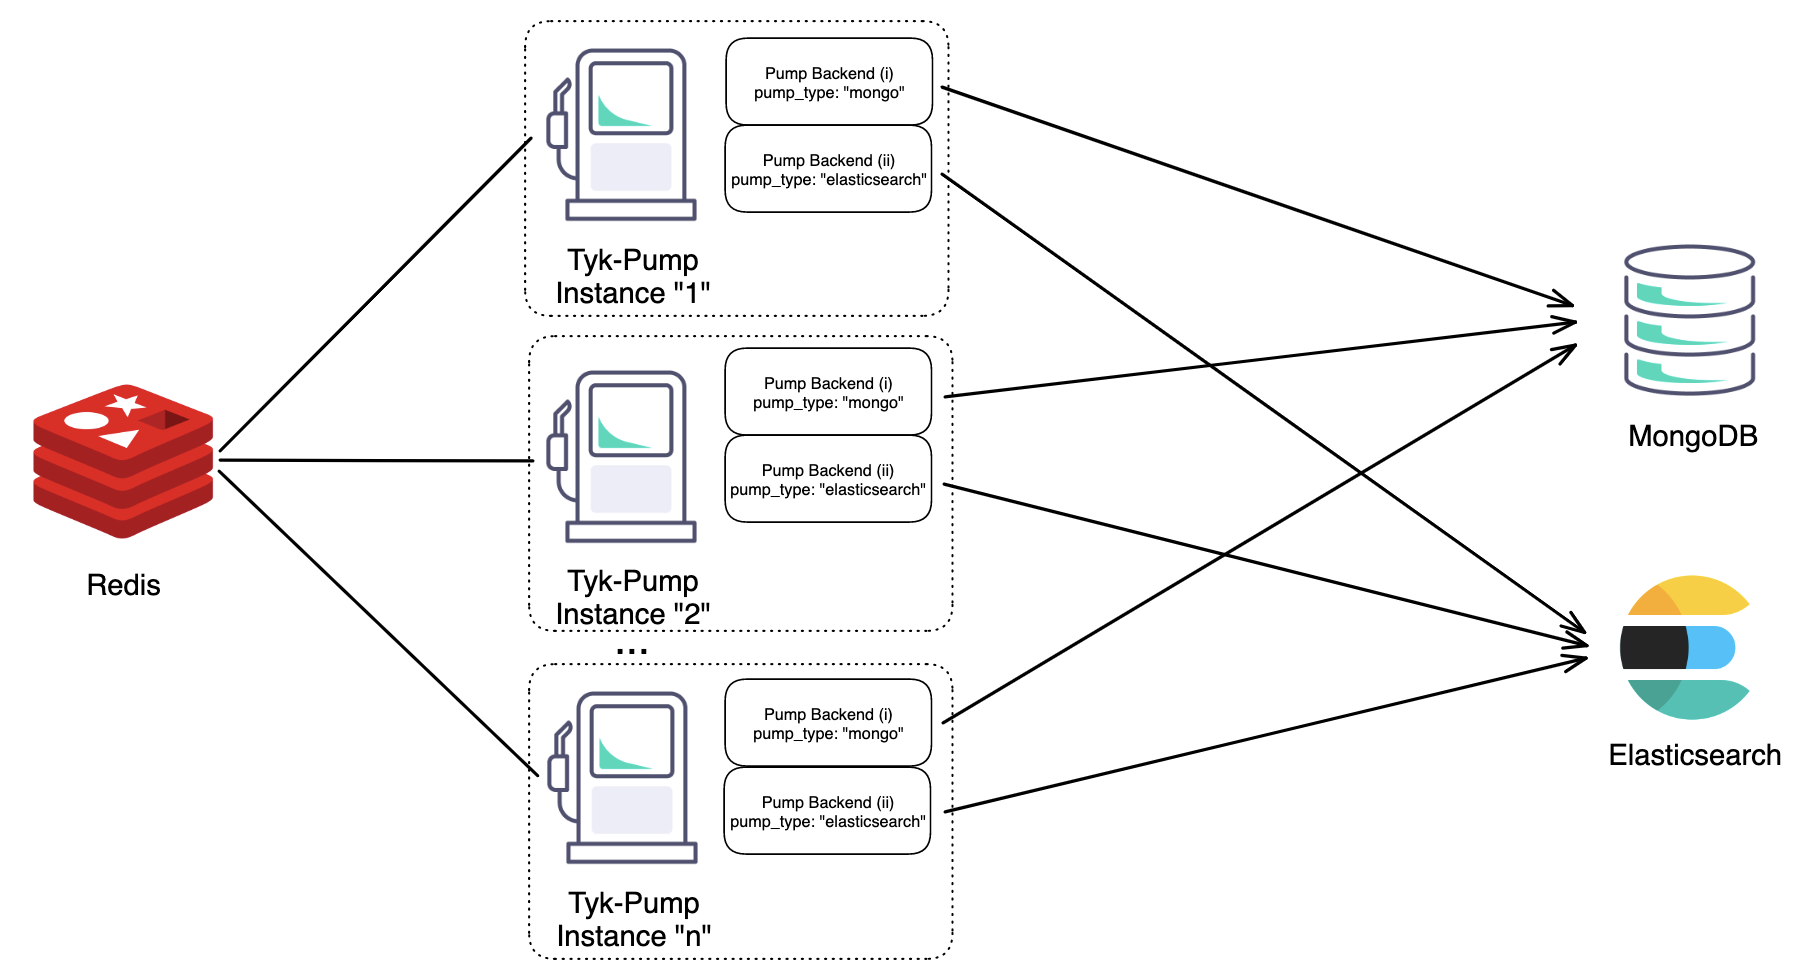
The figure below shows each Tyk Pump instance ("1", "2", and "n") running two pumps concurrently, labeled Pump Backend (i) and (ii), with `pump_type: "mongo"` and `pump_type: "elasticsearch"` respectively.
|
Tyk Pump is flexible: you can run multiple pumps in a single instance to write the same traffic data to several destinations at once. It's also scalable, both horizontally and vertically.
The figure below shows each Tyk Pump instance ("1", "2", and "n") running two pumps concurrently, labeled Pump Backend (i) and (ii), with `pump_type: "mongo"` and `pump_type: "elasticsearch"` respectively.
|  |
| :---------------------------------------------------------------------------------------------------------------------------------------------------------------------------------------------------------------------------------------------------------------------------------------------------------------------------------------------------------------------------------------------------------------------------------------------------------------------------------------------------------------------------------------------------------------------------------------------------------------------------------------------------------------------------------------------------------------------------------------------------------------------------------------------------------------------------------------------------------------------------------------------------------------------------------------------------------------------------------------------------------------------------------------------------------------------------------------------------------------------------------------------------------------------------------------------------------------------------------------------------------------------------------------------------------------------------------------------------------------------------------------------------------------------------------------------------------------------------------------------------------------------------------------------------------------------------------------------------------------------------------------------------------------- |
| Figure 1: An architecture diagram illustrating horizontal scaling of "n" instances of Tyk Pump, each running two pumps. |
Tyk Pump can be horizontally scaled without causing duplicate data, provided your configuration follows one of the supported combinations below:
| Configuration | Supported |
| :-------------------------------------------- | :-------: |
| Single pump instance, single backend | ✅ |
| Single pump instance, multiple backends | ✅ |
| Multiple pump instances, same backend(s) | ✅ |
| Multiple pump instances, different backend(s) | ❌ |
You can apply filters to control which records go to which destination: see [Sharding Analytics to Different Data Sinks](#sharding-analytics-to-different-data-sinks).
## Installing Tyk Pump
Tyk Pump is installed as part of a Tyk Self-Managed or Tyk Open Source deployment. See the [Tyk Self-Managed installation options](/docs/tyk-self-managed/install) or [Tyk Open Source installation](/docs/apim/open-source/installation) for platform-specific instructions (Docker, Kubernetes, Linux packages).
Set the `TYK_PMP_OMITCONFIGFILE` environment variable to omit `pump.conf` entirely and configure Tyk Pump purely from environment variables. This is particularly useful in Docker, since the Tyk Pump image ships with a default configuration file with pre-loaded pumps.
## Configuring Tyk Pump
Tyk Pump is configured through a JSON file, conventionally called `pump.conf`, or through equivalent environment variables:
```json theme={null}
{
"analytics_storage_type": "redis",
"analytics_storage_config": { ... },
"purge_delay": 1,
"purge_chunk": 0,
"storage_expiration_time": 60,
"log_level": "info",
"log_format": "text",
"health_check_endpoint_name": "health",
"health_check_endpoint_port": 8083,
"enable_http_profiler": false,
"statsd_connection_string": "",
"statsd_prefix": "",
"max_record_size": 0,
"uptime_pump_config": { ... },
"dont_purge_uptime_data": false,
"pumps": { ... }
}
```
For the full field-by-field reference, environment variable names, and default values for every pump type, see the [Tyk Pump configuration reference](/docs/tyk-pump/tyk-pump-configuration/tyk-pump-environment-variables). For the fields contained in a traffic log itself, see [Traffic Log Field Reference](/docs/api-management/logs/traffic-logs#traffic-log-field-reference).
### Connecting to Redis
`analytics_storage_config` is the Redis instance Tyk Pump reads traffic logs from, the same Redis that Tyk Gateway writes to. For single-node, Cluster, and Sentinel configuration, connection pool tuning, and TLS, see [Configure Redis](/docs/tyk-configuration-reference/redis-cluster-sentinel), which covers Tyk Gateway, Tyk Dashboard, and Tyk Pump together.
### Purge Configuration
```json theme={null}
{
"purge_delay": 1,
"purge_chunk": 0,
"storage_expiration_time": 60
}
```
| Field | Default | Description |
| :------------------------ | :---------------------- | :----------------------------------------------------------------------------------------------------------------------------------- |
| `purge_delay` | `1` | Seconds Tyk Pump waits between checking Redis for new analytics data and purging it. |
| `purge_chunk` | Unset (all in one pass) | Maximum traffic logs to pull from Redis at a time. If set, `storage_expiration_time` is used to reset the traffic log's TTL instead. |
| `storage_expiration_time` | `60` seconds | TTL applied to traffic logs in Redis. Only takes effect if `purge_chunk` is set. |
### Logging and Health Checks
```json theme={null}
{
"log_level": "info",
"log_format": "text",
"health_check_endpoint_name": "health",
"health_check_endpoint_port": 8083,
"enable_http_profiler": false
}
```
| Field | Default | Description |
| :--------------------------- | :------- | :-------------------------------------------------------------------------------------------------------------------------------------------------------------------------------------------------- |
| `log_level` | `info` | `info`, `debug`, `error`, or `warn`. |
| `log_format` | `text` | `text`, `json`, or `legacy`. From Tyk Pump 1.16.0, `text` and `json` use RFC3339 timestamps and map the `msg` field to `message`; `legacy` preserves the previous timestamp format and field names. |
| `health_check_endpoint_name` | `health` | Path for the HTTP health check endpoint. |
| `health_check_endpoint_port` | `8083` | Port for the HTTP health check endpoint. Returns `{"status": "ok"}` with a `200` response while Tyk Pump is running. |
| `enable_http_profiler` | `false` | Exposes Go profiling information to support debugging, the same way as [Tyk Gateway](/docs/api-management/troubleshooting-debugging). |
### Instrumentation
```json theme={null}
{
"statsd_connection_string": "",
"statsd_prefix": ""
}
```
`statsd_connection_string` and `statsd_prefix` configure Tyk Pump to send its own operational metrics to a StatsD server, separate from any traffic-derived metrics sent by the [`statsd`/`dogstatsd` Metrics Pumps](/docs/api-management/metrics/metrics-pumps). Only takes effect when `TYK_INSTRUMENTATION=1` is set. See [Configuring StatsD](/docs/api-management/logs-metrics#configuring-statsd) for details.
### Uptime Test Results
```json theme={null}
{
"uptime_pump_config": { ... },
"dont_purge_uptime_data": false
}
```
`uptime_pump_config` stores the results of Tyk Gateway's own uptime tests, periodic health checks against upstream hosts. It's unrelated to traffic logs and configured independently of `pumps`. See [Uptime Tests](/docs/planning-for-production/ensure-high-availability/uptime-tests#monitoring-uptime-tests-in-tyk-dashboard) for configuration.
`dont_purge_uptime_data` defaults to `false`, which starts an Uptime Pump on every Tyk Pump launch, even if you haven't configured a real `uptime_pump_config` target. If it can't connect to a persistent store, **Tyk Pump exits immediately, taking down every other pump in that instance too.**
**Set `dont_purge_uptime_data: true` if you're not using the Uptime Pump.**
### Declaring Pumps
At least one pump must be configured in the `pumps` object:
```json theme={null}
{
"pumps": {
"": {
"type": "",
"meta": {
...
},
...
}
}
}
```
`` is more than a label: it's also the environment variable prefix for that pump, `TYK_PMP_PUMPS__`. For example, naming a pump `PROD` lets you configure it with `TYK_PMP_PUMPS_PROD_TYPE`, `TYK_PMP_PUMPS_PROD_META_...`, and so on, whether or not it's also declared in `pump.conf`. If you omit `type` from the JSON block entirely, Tyk Pump also falls back to using `` itself as the type.
Beyond that, `` is logged once, when Tyk Pump starts up, and then dropped: at runtime, warnings, errors, and metrics identify a pump by its type's display name (for example, "Mongo Pump"), not by this name. If you run multiple instances of the same type, choose names that help you tell them apart in configuration, but expect their ongoing logs to look identical.
The `type` is selected from the [Pump Type Catalog](#pump-type-catalog) and determines the specific `meta` configuration; there is also [common configuration](#common-pump-settings) that is applicable to all pump types.
## Common Pump Settings
Every pump entry accepts the following settings, alongside its `type` and `meta`:
```json theme={null}
{
"pumps": {
"": {
"type": "",
"meta": {
...
},
"filters": {
...
},
"timeout": 0,
"omit_detailed_recording": false,
"max_record_size": 0,
"ignore_fields": [],
"raw_request_decoded": false,
"raw_response_decoded": false
}
}
}
```
| Field | Description |
| :--------------------------------------------- | :--------------------------------------------------------------------------------------------------------------------------------------------------------------------------------- |
| `type` | Selects the pump type to use, from the [Pump Type Catalog](#pump-type-catalog) below. |
| `meta` | Pump-type-specific settings. |
| `filters` | Restricts which records this pump receives, by API, Organisation, or response code. See [Sharding Analytics to Different Data Sinks](#sharding-analytics-to-different-data-sinks). |
| `timeout` | Maximum time to wait for a write to complete, in seconds. Defaults to `0` (wait indefinitely). See [Pump Timeout](#pump-timeout). |
| `omit_detailed_recording` | Excludes the `raw_request` and `raw_response` fields from this pump's records. See [Omit Detailed Recording](#omit-detailed-recording). |
| `max_record_size` | Caps the size, in bytes, of the `raw_request` and `raw_response` fields. See [Max Record Size](#max-record-size). |
| `ignore_fields` | Excludes specific traffic log fields from this pump's records. See [Ignore Fields](#ignore-fields). |
| `raw_request_decoded` / `raw_response_decoded` | Base64-decodes the raw request or response before writing. See [Decode Raw Request and Raw Response](#decode-raw-request-and-raw-response). |
### Sharding Analytics to Different Data Sinks
In a multi-Organisation deployment, each Organisation, team, or environment might have a preferred destination. The `filters` field, available on every pump, lets you control which records are sent to which pump using an allowlist and a blocklist:
```json theme={null}
"filters":{
"api_ids":[],
"org_ids":[],
"response_codes":[],
"skip_api_ids":[],
"skip_org_ids":[],
"skip_response_codes":[]
}
```
* `api_ids`, `org_ids`, and `response_codes` act as an allowlist: only matching records are sent to this pump.
* `skip_api_ids`, `skip_org_ids`, and `skip_response_codes` act as a blocklist: matching records are never sent to this pump.
* The blocklist always takes priority over the allowlist.
For example, this configuration sends all analytics for `org1` and `org2` to a CSV file, and everything except `api_id_1` to Elasticsearch:
```json theme={null}
"csv": {
"type": "csv",
"filters": {
"org_ids": ["org1", "org2"]
},
...
},
"elasticsearch": {
"type": "elasticsearch",
"filters": {
"skip_api_ids": ["api_id_1"]
},
...
}
```
### Pump Timeout
By default, Tyk Pump waits indefinitely for each write operation to complete (`timeout: 0`). You can configure an optional `timeout`, in seconds, per pump:
```json theme={null}
"mongo": {
"type": "mongo",
"timeout": 5,
...
}
```
If a pump's write operation takes longer than the [purge loop interval](#purge-configuration) (`purge_delay`) and no timeout is configured, Tyk Pump logs: `Pump PMP_NAME is taking more time than the value configured of purge_delay. You should try to set a timeout for this pump.`
If a timeout is configured and the pump is still falling behind, it logs: `Pump PMP_NAME is taking more time than the value configured of purge_delay. You should try lowering the timeout configured for this pump.`
### Omit Detailed Recording
`omit_detailed_recording`, set on a pump, stops that pump from writing the `raw_request` and `raw_response` fields for every record. Defaults to `false`.
### Max Record Size
`max_record_size` caps the size, in bytes, of the `raw_request` and `raw_response` fields written by a pump. Defaults to `0` (unlimited). Set it at the top level of `pump.conf` to apply a default to every pump:
```json theme={null}
{
"max_record_size": 1000,
"pumps": { ... }
}
```
Or set it on a specific pump instead, which takes precedence over the global default for that pump only:
```json theme={null}
"csv": {
"type": "csv",
"max_record_size": 1000,
...
}
```
### Ignore Fields
`ignore_fields` lists fields, by JSON tag, to exclude when a pump writes its record. Useful for keeping sensitive or unneeded data out of a specific destination:
```json theme={null}
"csv": {
"type": "csv",
"ignore_fields": ["api_id", "api_version"],
...
}
```
### Decode Raw Request and Raw Response
When [detailed recording](/docs/api-management/logs/traffic-logs#detailed-recording) is configured in Tyk Gateway, the full request and response will be base64-encoded and stored in the [`raw_request`](/docs/api-management/logs/traffic-logs#param-raw-request) and [`raw_response`](/docs/api-management/logs/traffic-logs#param-raw-response) fields respectively in the traffic log.
The pump can optionally remove the base64-encoding before writing the record to the target, which avoids the need for post-processing by your analytics package.
Decoding of request and response are individually controlled using `raw_request_decoded` and `raw_response_decoded` (both default to `false`).
```json theme={null}
"csv": {
"type": "csv",
"raw_request_decoded": true,
"raw_response_decoded": true
...
}
```
Do not decode the request and response data when transferring the unaggregated traffic logs to the control plane's persistent storage for Tyk Dashboard's Log Browser. The Dashboard automatically base64-decodes this data when displaying a record; if this decoding has already been performed by Tyk Pump, the result will be nonsense in the Log Browser display. Only decode for destinations that read the data directly, such as an external sink.
## Pump Type Catalog
Tyk Pump's pump types fall into three categories, each covered in more detail on its own page. Every pump type is configured the same way: an entry under `pumps` with a `type` and a `meta` block.
This doesn't include the uptime pump, covered separately under [Uptime Test Results](#uptime-test-results) above.
### Dashboard Analytics Pumps
Dashboard Analytics pumps transfer, and in some cases aggregate, traffic logs to the persistent storage. Tyk Dashboard's Log Browser and Traffic Analytics screens require different data and hence separate pumps.
When using a combined control and data plane deployment (such as with the `tyk-stack` chart), you only need [Control Plane Pumps](#control-plane-pumps). When using a distributed deployment with separate control and data planes, connected via Tyk MDCB, you also need a [Data Plane Pump](#data-plane-pump) to get the data to the control plane.
#### Control Plane Pumps
| Type | Purpose | Storage Type | Configuration |
| :--------------------- | :--------------------------------------------------------------------- | :----------- | :----------------------------------------------------------------------------------------------------------------- |
| `mongo` | Log Browser | MongoDB | [Standard Mongo Pump](/docs/api-management/dashboard-analytics/control-plane-pumps#standard-mongo-pump) |
| `mongo-pump-selective` | Log Browser, split per Organisation | MongoDB | [Per-Organisation Mongo Pump](/docs/api-management/dashboard-analytics/control-plane-pumps#per-organisation-mongo-pump) |
| `mongo-pump-aggregate` | Traffic Analytics graphs | MongoDB | [Mongo Aggregate Pump](/docs/api-management/dashboard-analytics/control-plane-pumps#mongo-aggregate-pump) |
| `sql` | Log Browser | SQL | [Standard SQL Pump](/docs/api-management/dashboard-analytics/control-plane-pumps#standard-sql-pump) |
| `sql_aggregate` | Traffic Analytics graphs | SQL | [SQL Aggregate Pump](/docs/api-management/dashboard-analytics/control-plane-pumps#sql-aggregate-pump) |
| `mongo-graph` | GraphQL-specific traffic logs: types, fields, and errors requested | MongoDB | [Mongo GraphQL Pump](/docs/api-management/dashboard-analytics/control-plane-pumps#mongo-graphql-pump) |
| `sql-graph` | GraphQL-specific traffic logs: types, fields, and errors requested | SQL | [SQL GraphQL Pump](/docs/api-management/dashboard-analytics/control-plane-pumps#sql-graphql-pump) |
| `sql-graph-aggregate` | Aggregated GraphQL-specific analytics, mirroring `sql_aggregate` | SQL | [SQL GraphQL Aggregate Pump](/docs/api-management/dashboard-analytics/control-plane-pumps#sql-graphql-aggregate-pump) |
| `mongo-mcp` | MCP (Model Context Protocol) tool-call traffic logs, mirroring `mongo` | MongoDB | [Mongo MCP Pump](/docs/api-management/dashboard-analytics/control-plane-pumps#mongo-mcp-pump) |
| `mongo-mcp-aggregate` | Aggregated MCP-specific analytics, mirroring `mongo-pump-aggregate` | MongoDB | [Mongo MCP Aggregate Pump](/docs/api-management/dashboard-analytics/control-plane-pumps#mongo-mcp-aggregate-pump) |
| `sql-mcp` | MCP tool-call traffic logs, mirroring `sql` | SQL | [SQL MCP Pump](/docs/api-management/dashboard-analytics/control-plane-pumps#sql-mcp-pump) |
| `sql-mcp-aggregate` | Aggregated MCP-specific analytics, mirroring `sql_aggregate` | SQL | [SQL MCP Aggregate Pump](/docs/api-management/dashboard-analytics/control-plane-pumps#sql-mcp-aggregate-pump) |
Unlike Mongo, SQL has an aggregate GraphQL pump; there's no `mongo-graph-aggregate` equivalent.
#### Data Plane Pump
For separate control and data planes you must transfer the traffic logs from the data plane (where they are generated) to the control plane (where they are used by Tyk Dashboard). A `hybrid` pump should be deployed in each data plane to transfer the records to Tyk MDCB.
| Type | Purpose | Configuration |
| :------- | :---------------------------------------------------------------------------- | :--------------------------------------------------------------------- |
| `hybrid` | Forwards traffic logs, or aggregated analytics, from a data plane to Tyk MDCB | [Data Plane Pump](/docs/api-management/dashboard-analytics/data-plane-pump) |
As explained in the dedicated [Data Plane Pump](/docs/api-management/dashboard-analytics/data-plane-pump) section, once data reaches Tyk MDCB, it must be transferred to the control plane's persistent storage via one of two options: Tyk MDCB's own built-in writer or a [Control Plane Pump](#control-plane-pumps): an ordinary Tyk Pump instance running one of the pump types listed above.
The `hybrid` pump can create aggregated analytics from MCP proxy and standard REST API traffic logs, but cannot create aggregated analytics for GraphQL API traffic.
### External Data Sink Pumps
Forward traffic logs, unaltered, to external tools. Considered the legacy approach: for new integrations, use [OpenTelemetry tracing](/docs/api-management/traces) instead.
| Type | Description |
| :------------------------------------------------------------------------ | :-------------------------------------------------------------------------- |
| [`csv`](/docs/api-management/logs/external-data-sinks#csv) | Writes traffic logs to local CSV files |
| [`elasticsearch`](/docs/api-management/logs/external-data-sinks#elasticsearch) | Indexes traffic logs in Elasticsearch |
| [`graylog`](/docs/api-management/logs/external-data-sinks#graylog) | Forwards traffic logs to Graylog |
| [`influx`](/docs/api-management/logs/external-data-sinks#influxdb) | Writes traffic logs to InfluxDB v1 |
| [`influx2`](/docs/api-management/logs/external-data-sinks#influx2) | Writes traffic logs to InfluxDB v2 |
| [`kafka`](/docs/api-management/logs/external-data-sinks#kafka) | Publishes traffic logs to a Kafka topic |
| [`kinesis`](/docs/api-management/logs/external-data-sinks#kinesis) | Publishes traffic logs to an Amazon Kinesis stream |
| [`logzio`](/docs/api-management/logs/external-data-sinks#logz-io) | Forwards traffic logs to Logz.io |
| [`moesif`](/docs/api-management/logs/external-data-sinks#moesif) | Forwards traffic logs to Moesif |
| [`resurfaceio`](/docs/api-management/logs/external-data-sinks#resurface-io) | Forwards traffic logs to Resurface.io |
| [`segment`](/docs/api-management/logs/external-data-sinks#segment) | Forwards traffic logs to Segment |
| [`splunk`](/docs/api-management/logs/external-data-sinks#splunk) | Forwards traffic logs to Splunk |
| [`sqs`](/docs/api-management/logs/external-data-sinks#sqs) | Publishes traffic logs to an Amazon SQS queue |
| [`stdout`](/docs/api-management/logs/external-data-sinks#stdout) | Writes traffic logs to standard output, useful for container log collectors |
| [`syslog`](/docs/api-management/logs/external-data-sinks#syslog) | Forwards traffic logs to a syslog server |
| [`timestream`](/docs/api-management/logs/external-data-sinks#timestream) | Writes traffic logs to Amazon Timestream |
### Metrics Pumps
Derive per-request metrics from traffic logs, rather than forwarding the full record. Considered the legacy approach: for new integrations, use [OpenTelemetry metrics](/docs/api-management/logs-metrics#opentelemetry-metrics) instead.
| Type | Description |
| :--------------------------------------------------------------------- | :------------------------------------------------------------------------ |
| [`dogstatsd`](/docs/api-management/metrics/metrics-pumps#dogstatsd-datadog) | Sends per-request metrics in the DogStatsD format, for example to Datadog |
| [`prometheus`](/docs/api-management/metrics/metrics-pumps#prometheus) | Exposes an HTTP endpoint for Prometheus to scrape |
| [`statsd`](/docs/api-management/metrics/metrics-pumps#statsd) | Sends per-request metrics to a StatsD server |
Some pump types accept a `filters` object to restrict which Organisations or APIs they receive data for; see [Sharding Analytics to Different Data Sinks](#sharding-analytics-to-different-data-sinks) above.
## Demo Mode
Tyk Pump can generate synthetic analytics data and send it to your configured pumps, without needing any live API traffic. This is useful for previewing Tyk Dashboard's Traffic Analytics and Log Browser with realistic-looking data, for example while evaluating Tyk, or for testing a new pump configuration in isolation before pointing it at live traffic.
Demo mode is controlled by command-line flags when starting Tyk Pump, not by `pump.conf` or environment variables. `--demo` is required to enable it; the rest are optional and customize the generated data:
| Flag | Default | Description |
| :------------------------------------------- | :------------------------ | :----------------------------------------------------------------------------------------------------------------------------------------------------------------------------------------------------- |
| `--demo=` | Required | Enables demo mode for the given Organisation ID. |
| `--demo-api=` | Random ID | The `API_ID` to record for all demo transactions. |
| `--demo-api-version=` | - | The API version to record for demo transactions. |
| `--demo-days=` | `30` | How many days of demo data to generate. |
| `--demo-records-per-hour=` | `0` (random 300-500/hour) | Records generated per hour. |
| `--demo-future-data` | `false` | Generates data forward from now instead of backward. |
| `--demo-track-path` | `false` | Enables request path tracking in demo data. Overridden by an Aggregate Pump's own [`track_all_paths`](/docs/api-management/dashboard-analytics/control-plane-pumps#mongo-aggregate-pump), if set to `true`. |
|
| :---------------------------------------------------------------------------------------------------------------------------------------------------------------------------------------------------------------------------------------------------------------------------------------------------------------------------------------------------------------------------------------------------------------------------------------------------------------------------------------------------------------------------------------------------------------------------------------------------------------------------------------------------------------------------------------------------------------------------------------------------------------------------------------------------------------------------------------------------------------------------------------------------------------------------------------------------------------------------------------------------------------------------------------------------------------------------------------------------------------------------------------------------------------------------------------------------------------------------------------------------------------------------------------------------------------------------------------------------------------------------------------------------------------------------------------------------------------------------------------------------------------------------------------------------------------------------------------------------------------------------------------------------------------- |
| Figure 1: An architecture diagram illustrating horizontal scaling of "n" instances of Tyk Pump, each running two pumps. |
Tyk Pump can be horizontally scaled without causing duplicate data, provided your configuration follows one of the supported combinations below:
| Configuration | Supported |
| :-------------------------------------------- | :-------: |
| Single pump instance, single backend | ✅ |
| Single pump instance, multiple backends | ✅ |
| Multiple pump instances, same backend(s) | ✅ |
| Multiple pump instances, different backend(s) | ❌ |
You can apply filters to control which records go to which destination: see [Sharding Analytics to Different Data Sinks](#sharding-analytics-to-different-data-sinks).
## Installing Tyk Pump
Tyk Pump is installed as part of a Tyk Self-Managed or Tyk Open Source deployment. See the [Tyk Self-Managed installation options](/docs/tyk-self-managed/install) or [Tyk Open Source installation](/docs/apim/open-source/installation) for platform-specific instructions (Docker, Kubernetes, Linux packages).
Set the `TYK_PMP_OMITCONFIGFILE` environment variable to omit `pump.conf` entirely and configure Tyk Pump purely from environment variables. This is particularly useful in Docker, since the Tyk Pump image ships with a default configuration file with pre-loaded pumps.
## Configuring Tyk Pump
Tyk Pump is configured through a JSON file, conventionally called `pump.conf`, or through equivalent environment variables:
```json theme={null}
{
"analytics_storage_type": "redis",
"analytics_storage_config": { ... },
"purge_delay": 1,
"purge_chunk": 0,
"storage_expiration_time": 60,
"log_level": "info",
"log_format": "text",
"health_check_endpoint_name": "health",
"health_check_endpoint_port": 8083,
"enable_http_profiler": false,
"statsd_connection_string": "",
"statsd_prefix": "",
"max_record_size": 0,
"uptime_pump_config": { ... },
"dont_purge_uptime_data": false,
"pumps": { ... }
}
```
For the full field-by-field reference, environment variable names, and default values for every pump type, see the [Tyk Pump configuration reference](/docs/tyk-pump/tyk-pump-configuration/tyk-pump-environment-variables). For the fields contained in a traffic log itself, see [Traffic Log Field Reference](/docs/api-management/logs/traffic-logs#traffic-log-field-reference).
### Connecting to Redis
`analytics_storage_config` is the Redis instance Tyk Pump reads traffic logs from, the same Redis that Tyk Gateway writes to. For single-node, Cluster, and Sentinel configuration, connection pool tuning, and TLS, see [Configure Redis](/docs/tyk-configuration-reference/redis-cluster-sentinel), which covers Tyk Gateway, Tyk Dashboard, and Tyk Pump together.
### Purge Configuration
```json theme={null}
{
"purge_delay": 1,
"purge_chunk": 0,
"storage_expiration_time": 60
}
```
| Field | Default | Description |
| :------------------------ | :---------------------- | :----------------------------------------------------------------------------------------------------------------------------------- |
| `purge_delay` | `1` | Seconds Tyk Pump waits between checking Redis for new analytics data and purging it. |
| `purge_chunk` | Unset (all in one pass) | Maximum traffic logs to pull from Redis at a time. If set, `storage_expiration_time` is used to reset the traffic log's TTL instead. |
| `storage_expiration_time` | `60` seconds | TTL applied to traffic logs in Redis. Only takes effect if `purge_chunk` is set. |
### Logging and Health Checks
```json theme={null}
{
"log_level": "info",
"log_format": "text",
"health_check_endpoint_name": "health",
"health_check_endpoint_port": 8083,
"enable_http_profiler": false
}
```
| Field | Default | Description |
| :--------------------------- | :------- | :-------------------------------------------------------------------------------------------------------------------------------------------------------------------------------------------------- |
| `log_level` | `info` | `info`, `debug`, `error`, or `warn`. |
| `log_format` | `text` | `text`, `json`, or `legacy`. From Tyk Pump 1.16.0, `text` and `json` use RFC3339 timestamps and map the `msg` field to `message`; `legacy` preserves the previous timestamp format and field names. |
| `health_check_endpoint_name` | `health` | Path for the HTTP health check endpoint. |
| `health_check_endpoint_port` | `8083` | Port for the HTTP health check endpoint. Returns `{"status": "ok"}` with a `200` response while Tyk Pump is running. |
| `enable_http_profiler` | `false` | Exposes Go profiling information to support debugging, the same way as [Tyk Gateway](/docs/api-management/troubleshooting-debugging). |
### Instrumentation
```json theme={null}
{
"statsd_connection_string": "",
"statsd_prefix": ""
}
```
`statsd_connection_string` and `statsd_prefix` configure Tyk Pump to send its own operational metrics to a StatsD server, separate from any traffic-derived metrics sent by the [`statsd`/`dogstatsd` Metrics Pumps](/docs/api-management/metrics/metrics-pumps). Only takes effect when `TYK_INSTRUMENTATION=1` is set. See [Configuring StatsD](/docs/api-management/logs-metrics#configuring-statsd) for details.
### Uptime Test Results
```json theme={null}
{
"uptime_pump_config": { ... },
"dont_purge_uptime_data": false
}
```
`uptime_pump_config` stores the results of Tyk Gateway's own uptime tests, periodic health checks against upstream hosts. It's unrelated to traffic logs and configured independently of `pumps`. See [Uptime Tests](/docs/planning-for-production/ensure-high-availability/uptime-tests#monitoring-uptime-tests-in-tyk-dashboard) for configuration.
`dont_purge_uptime_data` defaults to `false`, which starts an Uptime Pump on every Tyk Pump launch, even if you haven't configured a real `uptime_pump_config` target. If it can't connect to a persistent store, **Tyk Pump exits immediately, taking down every other pump in that instance too.**
**Set `dont_purge_uptime_data: true` if you're not using the Uptime Pump.**
### Declaring Pumps
At least one pump must be configured in the `pumps` object:
```json theme={null}
{
"pumps": {
"": {
"type": "",
"meta": {
...
},
...
}
}
}
```
`` is more than a label: it's also the environment variable prefix for that pump, `TYK_PMP_PUMPS__`. For example, naming a pump `PROD` lets you configure it with `TYK_PMP_PUMPS_PROD_TYPE`, `TYK_PMP_PUMPS_PROD_META_...`, and so on, whether or not it's also declared in `pump.conf`. If you omit `type` from the JSON block entirely, Tyk Pump also falls back to using `` itself as the type.
Beyond that, `` is logged once, when Tyk Pump starts up, and then dropped: at runtime, warnings, errors, and metrics identify a pump by its type's display name (for example, "Mongo Pump"), not by this name. If you run multiple instances of the same type, choose names that help you tell them apart in configuration, but expect their ongoing logs to look identical.
The `type` is selected from the [Pump Type Catalog](#pump-type-catalog) and determines the specific `meta` configuration; there is also [common configuration](#common-pump-settings) that is applicable to all pump types.
## Common Pump Settings
Every pump entry accepts the following settings, alongside its `type` and `meta`:
```json theme={null}
{
"pumps": {
"": {
"type": "",
"meta": {
...
},
"filters": {
...
},
"timeout": 0,
"omit_detailed_recording": false,
"max_record_size": 0,
"ignore_fields": [],
"raw_request_decoded": false,
"raw_response_decoded": false
}
}
}
```
| Field | Description |
| :--------------------------------------------- | :--------------------------------------------------------------------------------------------------------------------------------------------------------------------------------- |
| `type` | Selects the pump type to use, from the [Pump Type Catalog](#pump-type-catalog) below. |
| `meta` | Pump-type-specific settings. |
| `filters` | Restricts which records this pump receives, by API, Organisation, or response code. See [Sharding Analytics to Different Data Sinks](#sharding-analytics-to-different-data-sinks). |
| `timeout` | Maximum time to wait for a write to complete, in seconds. Defaults to `0` (wait indefinitely). See [Pump Timeout](#pump-timeout). |
| `omit_detailed_recording` | Excludes the `raw_request` and `raw_response` fields from this pump's records. See [Omit Detailed Recording](#omit-detailed-recording). |
| `max_record_size` | Caps the size, in bytes, of the `raw_request` and `raw_response` fields. See [Max Record Size](#max-record-size). |
| `ignore_fields` | Excludes specific traffic log fields from this pump's records. See [Ignore Fields](#ignore-fields). |
| `raw_request_decoded` / `raw_response_decoded` | Base64-decodes the raw request or response before writing. See [Decode Raw Request and Raw Response](#decode-raw-request-and-raw-response). |
### Sharding Analytics to Different Data Sinks
In a multi-Organisation deployment, each Organisation, team, or environment might have a preferred destination. The `filters` field, available on every pump, lets you control which records are sent to which pump using an allowlist and a blocklist:
```json theme={null}
"filters":{
"api_ids":[],
"org_ids":[],
"response_codes":[],
"skip_api_ids":[],
"skip_org_ids":[],
"skip_response_codes":[]
}
```
* `api_ids`, `org_ids`, and `response_codes` act as an allowlist: only matching records are sent to this pump.
* `skip_api_ids`, `skip_org_ids`, and `skip_response_codes` act as a blocklist: matching records are never sent to this pump.
* The blocklist always takes priority over the allowlist.
For example, this configuration sends all analytics for `org1` and `org2` to a CSV file, and everything except `api_id_1` to Elasticsearch:
```json theme={null}
"csv": {
"type": "csv",
"filters": {
"org_ids": ["org1", "org2"]
},
...
},
"elasticsearch": {
"type": "elasticsearch",
"filters": {
"skip_api_ids": ["api_id_1"]
},
...
}
```
### Pump Timeout
By default, Tyk Pump waits indefinitely for each write operation to complete (`timeout: 0`). You can configure an optional `timeout`, in seconds, per pump:
```json theme={null}
"mongo": {
"type": "mongo",
"timeout": 5,
...
}
```
If a pump's write operation takes longer than the [purge loop interval](#purge-configuration) (`purge_delay`) and no timeout is configured, Tyk Pump logs: `Pump PMP_NAME is taking more time than the value configured of purge_delay. You should try to set a timeout for this pump.`
If a timeout is configured and the pump is still falling behind, it logs: `Pump PMP_NAME is taking more time than the value configured of purge_delay. You should try lowering the timeout configured for this pump.`
### Omit Detailed Recording
`omit_detailed_recording`, set on a pump, stops that pump from writing the `raw_request` and `raw_response` fields for every record. Defaults to `false`.
### Max Record Size
`max_record_size` caps the size, in bytes, of the `raw_request` and `raw_response` fields written by a pump. Defaults to `0` (unlimited). Set it at the top level of `pump.conf` to apply a default to every pump:
```json theme={null}
{
"max_record_size": 1000,
"pumps": { ... }
}
```
Or set it on a specific pump instead, which takes precedence over the global default for that pump only:
```json theme={null}
"csv": {
"type": "csv",
"max_record_size": 1000,
...
}
```
### Ignore Fields
`ignore_fields` lists fields, by JSON tag, to exclude when a pump writes its record. Useful for keeping sensitive or unneeded data out of a specific destination:
```json theme={null}
"csv": {
"type": "csv",
"ignore_fields": ["api_id", "api_version"],
...
}
```
### Decode Raw Request and Raw Response
When [detailed recording](/docs/api-management/logs/traffic-logs#detailed-recording) is configured in Tyk Gateway, the full request and response will be base64-encoded and stored in the [`raw_request`](/docs/api-management/logs/traffic-logs#param-raw-request) and [`raw_response`](/docs/api-management/logs/traffic-logs#param-raw-response) fields respectively in the traffic log.
The pump can optionally remove the base64-encoding before writing the record to the target, which avoids the need for post-processing by your analytics package.
Decoding of request and response are individually controlled using `raw_request_decoded` and `raw_response_decoded` (both default to `false`).
```json theme={null}
"csv": {
"type": "csv",
"raw_request_decoded": true,
"raw_response_decoded": true
...
}
```
Do not decode the request and response data when transferring the unaggregated traffic logs to the control plane's persistent storage for Tyk Dashboard's Log Browser. The Dashboard automatically base64-decodes this data when displaying a record; if this decoding has already been performed by Tyk Pump, the result will be nonsense in the Log Browser display. Only decode for destinations that read the data directly, such as an external sink.
## Pump Type Catalog
Tyk Pump's pump types fall into three categories, each covered in more detail on its own page. Every pump type is configured the same way: an entry under `pumps` with a `type` and a `meta` block.
This doesn't include the uptime pump, covered separately under [Uptime Test Results](#uptime-test-results) above.
### Dashboard Analytics Pumps
Dashboard Analytics pumps transfer, and in some cases aggregate, traffic logs to the persistent storage. Tyk Dashboard's Log Browser and Traffic Analytics screens require different data and hence separate pumps.
When using a combined control and data plane deployment (such as with the `tyk-stack` chart), you only need [Control Plane Pumps](#control-plane-pumps). When using a distributed deployment with separate control and data planes, connected via Tyk MDCB, you also need a [Data Plane Pump](#data-plane-pump) to get the data to the control plane.
#### Control Plane Pumps
| Type | Purpose | Storage Type | Configuration |
| :--------------------- | :--------------------------------------------------------------------- | :----------- | :----------------------------------------------------------------------------------------------------------------- |
| `mongo` | Log Browser | MongoDB | [Standard Mongo Pump](/docs/api-management/dashboard-analytics/control-plane-pumps#standard-mongo-pump) |
| `mongo-pump-selective` | Log Browser, split per Organisation | MongoDB | [Per-Organisation Mongo Pump](/docs/api-management/dashboard-analytics/control-plane-pumps#per-organisation-mongo-pump) |
| `mongo-pump-aggregate` | Traffic Analytics graphs | MongoDB | [Mongo Aggregate Pump](/docs/api-management/dashboard-analytics/control-plane-pumps#mongo-aggregate-pump) |
| `sql` | Log Browser | SQL | [Standard SQL Pump](/docs/api-management/dashboard-analytics/control-plane-pumps#standard-sql-pump) |
| `sql_aggregate` | Traffic Analytics graphs | SQL | [SQL Aggregate Pump](/docs/api-management/dashboard-analytics/control-plane-pumps#sql-aggregate-pump) |
| `mongo-graph` | GraphQL-specific traffic logs: types, fields, and errors requested | MongoDB | [Mongo GraphQL Pump](/docs/api-management/dashboard-analytics/control-plane-pumps#mongo-graphql-pump) |
| `sql-graph` | GraphQL-specific traffic logs: types, fields, and errors requested | SQL | [SQL GraphQL Pump](/docs/api-management/dashboard-analytics/control-plane-pumps#sql-graphql-pump) |
| `sql-graph-aggregate` | Aggregated GraphQL-specific analytics, mirroring `sql_aggregate` | SQL | [SQL GraphQL Aggregate Pump](/docs/api-management/dashboard-analytics/control-plane-pumps#sql-graphql-aggregate-pump) |
| `mongo-mcp` | MCP (Model Context Protocol) tool-call traffic logs, mirroring `mongo` | MongoDB | [Mongo MCP Pump](/docs/api-management/dashboard-analytics/control-plane-pumps#mongo-mcp-pump) |
| `mongo-mcp-aggregate` | Aggregated MCP-specific analytics, mirroring `mongo-pump-aggregate` | MongoDB | [Mongo MCP Aggregate Pump](/docs/api-management/dashboard-analytics/control-plane-pumps#mongo-mcp-aggregate-pump) |
| `sql-mcp` | MCP tool-call traffic logs, mirroring `sql` | SQL | [SQL MCP Pump](/docs/api-management/dashboard-analytics/control-plane-pumps#sql-mcp-pump) |
| `sql-mcp-aggregate` | Aggregated MCP-specific analytics, mirroring `sql_aggregate` | SQL | [SQL MCP Aggregate Pump](/docs/api-management/dashboard-analytics/control-plane-pumps#sql-mcp-aggregate-pump) |
Unlike Mongo, SQL has an aggregate GraphQL pump; there's no `mongo-graph-aggregate` equivalent.
#### Data Plane Pump
For separate control and data planes you must transfer the traffic logs from the data plane (where they are generated) to the control plane (where they are used by Tyk Dashboard). A `hybrid` pump should be deployed in each data plane to transfer the records to Tyk MDCB.
| Type | Purpose | Configuration |
| :------- | :---------------------------------------------------------------------------- | :--------------------------------------------------------------------- |
| `hybrid` | Forwards traffic logs, or aggregated analytics, from a data plane to Tyk MDCB | [Data Plane Pump](/docs/api-management/dashboard-analytics/data-plane-pump) |
As explained in the dedicated [Data Plane Pump](/docs/api-management/dashboard-analytics/data-plane-pump) section, once data reaches Tyk MDCB, it must be transferred to the control plane's persistent storage via one of two options: Tyk MDCB's own built-in writer or a [Control Plane Pump](#control-plane-pumps): an ordinary Tyk Pump instance running one of the pump types listed above.
The `hybrid` pump can create aggregated analytics from MCP proxy and standard REST API traffic logs, but cannot create aggregated analytics for GraphQL API traffic.
### External Data Sink Pumps
Forward traffic logs, unaltered, to external tools. Considered the legacy approach: for new integrations, use [OpenTelemetry tracing](/docs/api-management/traces) instead.
| Type | Description |
| :------------------------------------------------------------------------ | :-------------------------------------------------------------------------- |
| [`csv`](/docs/api-management/logs/external-data-sinks#csv) | Writes traffic logs to local CSV files |
| [`elasticsearch`](/docs/api-management/logs/external-data-sinks#elasticsearch) | Indexes traffic logs in Elasticsearch |
| [`graylog`](/docs/api-management/logs/external-data-sinks#graylog) | Forwards traffic logs to Graylog |
| [`influx`](/docs/api-management/logs/external-data-sinks#influxdb) | Writes traffic logs to InfluxDB v1 |
| [`influx2`](/docs/api-management/logs/external-data-sinks#influx2) | Writes traffic logs to InfluxDB v2 |
| [`kafka`](/docs/api-management/logs/external-data-sinks#kafka) | Publishes traffic logs to a Kafka topic |
| [`kinesis`](/docs/api-management/logs/external-data-sinks#kinesis) | Publishes traffic logs to an Amazon Kinesis stream |
| [`logzio`](/docs/api-management/logs/external-data-sinks#logz-io) | Forwards traffic logs to Logz.io |
| [`moesif`](/docs/api-management/logs/external-data-sinks#moesif) | Forwards traffic logs to Moesif |
| [`resurfaceio`](/docs/api-management/logs/external-data-sinks#resurface-io) | Forwards traffic logs to Resurface.io |
| [`segment`](/docs/api-management/logs/external-data-sinks#segment) | Forwards traffic logs to Segment |
| [`splunk`](/docs/api-management/logs/external-data-sinks#splunk) | Forwards traffic logs to Splunk |
| [`sqs`](/docs/api-management/logs/external-data-sinks#sqs) | Publishes traffic logs to an Amazon SQS queue |
| [`stdout`](/docs/api-management/logs/external-data-sinks#stdout) | Writes traffic logs to standard output, useful for container log collectors |
| [`syslog`](/docs/api-management/logs/external-data-sinks#syslog) | Forwards traffic logs to a syslog server |
| [`timestream`](/docs/api-management/logs/external-data-sinks#timestream) | Writes traffic logs to Amazon Timestream |
### Metrics Pumps
Derive per-request metrics from traffic logs, rather than forwarding the full record. Considered the legacy approach: for new integrations, use [OpenTelemetry metrics](/docs/api-management/logs-metrics#opentelemetry-metrics) instead.
| Type | Description |
| :--------------------------------------------------------------------- | :------------------------------------------------------------------------ |
| [`dogstatsd`](/docs/api-management/metrics/metrics-pumps#dogstatsd-datadog) | Sends per-request metrics in the DogStatsD format, for example to Datadog |
| [`prometheus`](/docs/api-management/metrics/metrics-pumps#prometheus) | Exposes an HTTP endpoint for Prometheus to scrape |
| [`statsd`](/docs/api-management/metrics/metrics-pumps#statsd) | Sends per-request metrics to a StatsD server |
Some pump types accept a `filters` object to restrict which Organisations or APIs they receive data for; see [Sharding Analytics to Different Data Sinks](#sharding-analytics-to-different-data-sinks) above.
## Demo Mode
Tyk Pump can generate synthetic analytics data and send it to your configured pumps, without needing any live API traffic. This is useful for previewing Tyk Dashboard's Traffic Analytics and Log Browser with realistic-looking data, for example while evaluating Tyk, or for testing a new pump configuration in isolation before pointing it at live traffic.
Demo mode is controlled by command-line flags when starting Tyk Pump, not by `pump.conf` or environment variables. `--demo` is required to enable it; the rest are optional and customize the generated data:
| Flag | Default | Description |
| :------------------------------------------- | :------------------------ | :----------------------------------------------------------------------------------------------------------------------------------------------------------------------------------------------------- |
| `--demo=` | Required | Enables demo mode for the given Organisation ID. |
| `--demo-api=` | Random ID | The `API_ID` to record for all demo transactions. |
| `--demo-api-version=` | - | The API version to record for demo transactions. |
| `--demo-days=` | `30` | How many days of demo data to generate. |
| `--demo-records-per-hour=` | `0` (random 300-500/hour) | Records generated per hour. |
| `--demo-future-data` | `false` | Generates data forward from now instead of backward. |
| `--demo-track-path` | `false` | Enables request path tracking in demo data. Overridden by an Aggregate Pump's own [`track_all_paths`](/docs/api-management/dashboard-analytics/control-plane-pumps#mongo-aggregate-pump), if set to `true`. |